filter
filter (or fi) subcommand applies a convolutive filter on a a raster image.
$ rio georastertools filter --help
usage: rio georastertools filter [-h] {median,sum,mean,adaptive_gaussian} ...

Apply a filter to a set of images.

optional arguments:
  -h, --help            show this help message and exit

Filters:
  {median,sum,mean,adaptive_gaussian}
    median              Apply median filter
    sum                 Apply local sum filter
    mean                Apply local mean filter
    adaptive_gaussian   Apply adaptive gaussian filter
The available filters are Adaptive Gaussian, Local Sum, and Local Mean. Each filter is used as a sub-command and has specific arguments for filtering. To see the definitions of these arguments, type the option –help.
Median
$ rio georastertools filter median --help
  usage: rio georastertools filter median [-h] --kernel_size KERNEL_SIZE [-o OUTPUT]
                                   [-ws WINDOW_SIZE]
                                   [-p {none,edge,maximum,mean,median,minimum,reflect,symmetric,wrap}]
                                   [-b BANDS [BANDS ...]] [-a]
                                   inputs [inputs ...]

  Apply a median filter (see scipy median_filter for more information)

  positional arguments:
    inputs                Input file to process (e.g. Sentinel2 L2A MAJA from
                          THEIA). You can provide a single file with extension
                          ".lst" (e.g. "filtering.lst") that lists the input
                          files to process (one input file per line in .lst)

  optional arguments:
    -h, --help            show this help message and exit
    --kernel_size KERNEL_SIZE
                          Kernel size of the filter function, e.g. 3 means a
                          square of 3x3 pixels on which the filter function is
                          computed (default: 8)
    -o OUTPUT, --output OUTPUT
                          Output dir where to store results (by default current
                          dir)
    -ws WINDOW_SIZE, --window_size WINDOW_SIZE
                          Size of tiles to distribute processing, default: 1024
    -p {none,edge,maximum,mean,median,minimum,reflect,symmetric,wrap}, --pad {none,edge,maximum,mean,median,minimum,reflect,symmetric,wrap}
                          Pad to use around the image, default : edge (see https
                          ://numpy.org/doc/stable/reference/generated/numpy.pad.
                          html for more information)
    -b BANDS [BANDS ...], --bands BANDS [BANDS ...]
                          List of bands to compute
    -a, --all             Compute all bands

  By default only first band is computed.
The corresponding API functions that is called by the command line interface is the following :
- eolab.georastertools.processing.algo.median(input_data: ndarray, kernel_size: int) ndarray[source]
Applies a Median Filter to the input data using scipy.ndimage.median_filter. The filter computes the median of the values contained within a sliding window determined by the kernel size.
- Parameters:
input_data (np.ndarray) – A 3D numpy array of shape (1, number_of_lines, number_of_columns) containing the Digital Elevation Model (DEM). The function only accepts arrays with one band.
kernel_size (int) – The size of the sliding window (kernel) used to compute the median.
- Returns:
A numpy array of the same shape as input_data, containing the filtered data with the median values computed in the specified kernel.
- Return type:
np.ndarray
- Raises:
ValueError – If input_data does not have 3 dimensions or if the first dimension is not of size 1, or if kernel_size is not a positive odd integer.
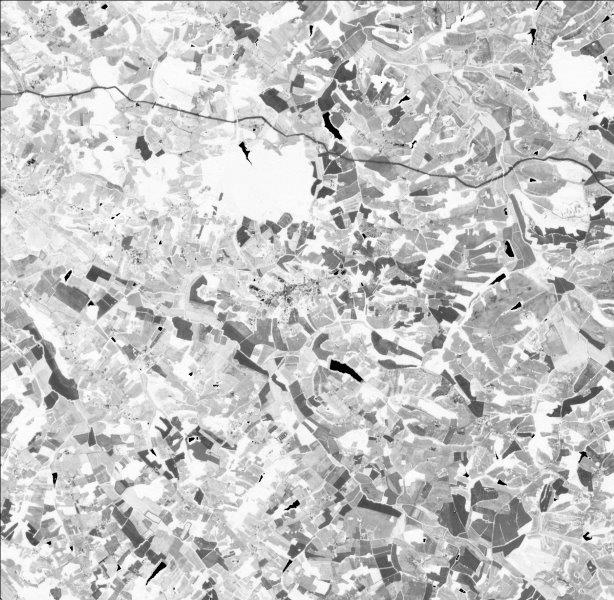
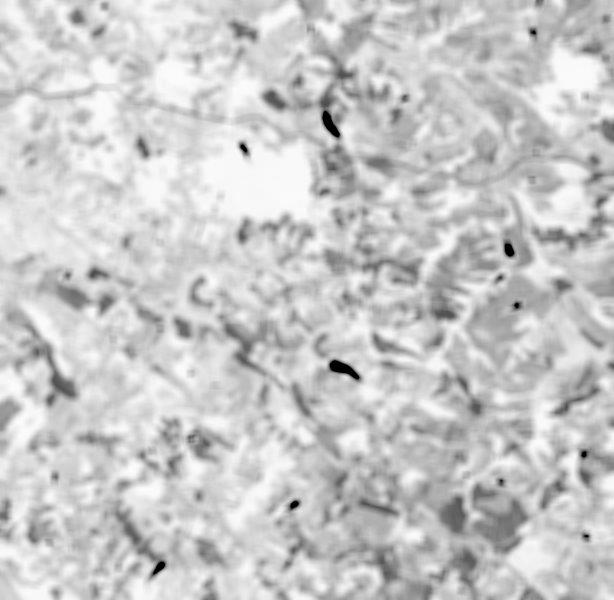
Here is an example of a median filter applied to the NDVI of a SENTINEL2 L2A THEIA image cropped to a region of interest. This raster was previously computed using radioindice on the original SENTINEL2 L2A THEIA image.
$ rio georastertools filter median --kernel_size 16 "./SENTINEL2A_20180928-105515-685_L2A_T30TYP_D-ndvi.tif"
Original
Filtered by Median

Local sum
$ rio georastertools filter sum --help
  usage: rio georastertools filter sum [-h] --kernel_size KERNEL_SIZE [-o OUTPUT]
                                [-ws WINDOW_SIZE]
                                [-p {none,edge,maximum,mean,median,minimum,reflect,symmetric,wrap}]
                                [-b BANDS [BANDS ...]] [-a]
                                inputs [inputs ...]

  Apply a local sum filter using integral image method

  positional arguments:
    inputs                Input file to process (e.g. Sentinel2 L2A MAJA from
                          THEIA). You can provide a single file with extension
                          ".lst" (e.g. "filtering.lst") that lists the input
                          files to process (one input file per line in .lst)

  optional arguments:
    -h, --help            show this help message and exit
    --kernel_size KERNEL_SIZE
                          Kernel size of the filter function, e.g. 3 means a
                          square of 3x3 pixels on which the filter function is
                          computed (default: 8)
    -o OUTPUT, --output OUTPUT
                          Output dir where to store results (by default current
                          dir)
    -ws WINDOW_SIZE, --window_size WINDOW_SIZE
                          Size of tiles to distribute processing, default: 1024
    -p {none,edge,maximum,mean,median,minimum,reflect,symmetric,wrap}, --pad {none,edge,maximum,mean,median,minimum,reflect,symmetric,wrap}
                          Pad to use around the image, default : edge (see https
                          ://numpy.org/doc/stable/reference/generated/numpy.pad.
                          html for more information)
    -b BANDS [BANDS ...], --bands BANDS [BANDS ...]
                          List of bands to compute
    -a, --all             Compute all bands

  By default only first band is computed.
The corresponding API functions that is called by the command line interface is the following :
- eolab.georastertools.processing.algo.local_sum(input_data: ndarray, kernel_size: int = 8) ndarray[source]
Computes the local sums of the input data using a sliding window defined by the kernel size. Each element in the output is the sum of the pixels within the specified kernel size window.
- Parameters:
input_data (np.ndarray) – A 3D numpy array of shape (1, number_of_lines, number_of_columns) containing the Digital Elevation Model (DEM). The function only accepts arrays with one band.
kernel_size (int) – The size of the sliding window used to compute the local sum.
- Returns:
A numpy array of the same size as input_data containing the computed local sums.
- Return type:
np.ndarray
- Raises:
ValueError – If input_data does not have 3 dimensions or if the first dimension is not of size 1.
Here is an example of the local mean applied to the NDVI of a SENTINEL2 L2A THEIA image cropped to a region of interest. This raster was previously computed using radioindice on the original SENTINEL2 L2A THEIA image.
$ rio georastertools filter sum --kernel_size 16 "./SENTINEL2A_20180928-105515-685_L2A_T30TYP_D-ndvi.tif"
Original
Filtered by Local sum

Local mean
$ rio georastertools filter mean --help
  usage: rio georastertools filter mean [-h] --kernel_size KERNEL_SIZE [-o OUTPUT]
                         [-ws WINDOW_SIZE]
                         [-p {none,edge,maximum,mean,median,minimum,reflect,symmetric,wrap}]
                         [-b BANDS [BANDS ...]] [-a]
                         inputs [inputs ...]

  Apply a local mean filter using integral image method

  positional arguments:
    inputs                Input file to process (e.g. Sentinel2 L2A MAJA from
                          THEIA). You can provide a single file with extension
                          ".lst" (e.g. "filtering.lst") that lists the input
                          files to process (one input file per line in .lst)

  optional arguments:
    -h, --help            show this help message and exit
    --kernel_size KERNEL_SIZE
                          Kernel size of the filter function, e.g. 3 means a
                          square of 3x3 pixels on which the filter function is
                          computed (default: 8)
    -o OUTPUT, --output OUTPUT
                          Output dir where to store results (by default current
                          dir)
    -ws WINDOW_SIZE, --window_size WINDOW_SIZE
                          Size of tiles to distribute processing, default: 1024
    -p {none,edge,maximum,mean,median,minimum,reflect,symmetric,wrap}, --pad {none,edge,maximum,mean,median,minimum,reflect,symmetric,wrap}
                          Pad to use around the image, default : edge (see https
                          ://numpy.org/doc/stable/reference/generated/numpy.pad.
                          html for more information)
    -b BANDS [BANDS ...], --bands BANDS [BANDS ...]
                          List of bands to compute
    -a, --all             Compute all bands

  By default only first band is computed.
The corresponding API functions that is called by the command line interface is the following :
- eolab.georastertools.processing.algo.local_mean(input_data: ndarray, kernel_size: int = 8) ndarray[source]
Computes the local means of the input data using a sliding window defined by the kernel size. Each element in the output is the mean of the pixels within the specified kernel size window.
- Parameters:
input_data (np.ndarray) – A 3D numpy array of shape (1, number_of_lines, number_of_columns) containing the Digital Elevation Model (DEM). The function only accepts arrays with one band.
kernel_size (int) – The size of the sliding window used to compute the local mean.
- Returns:
A numpy array of the same size as input_data containing the computed local means.
- Return type:
np.ndarray
- Raises:
ValueError – If input_data does not have 3 dimensions or if the first dimension is not of size 1.
Here is an example of the local mean applied to the NDVI of a SENTINEL2 L2A THEIA image cropped to a region of interest. This raster was previously computed using radioindice on the original SENTINEL2 L2A THEIA image.
$ rio georastertools filter mean --kernel_size 16 "./SENTINEL2A_20180928-105515-685_L2A_T30TYP_D-ndvi.tif"
Original
Filtered by Local mean
Adaptative gaussian
$ rio georastertools filter adaptive_gaussian --help
usage: rio georastertools filter adaptive_gaussian [-h] --kernel_size KERNEL_SIZE
                                            --sigma SIGMA [-o OUTPUT]
                                            [-ws WINDOW_SIZE]
                                            [-p {none,edge,maximum,mean,median,minimum,reflect,symmetric,wrap}]
                                            [-b BANDS [BANDS ...]] [-a]
                                            inputs [inputs ...]

Apply an adaptive (Local gaussian of 3x3) recursive filter on the input image

positional arguments:
  inputs                Input file to process (e.g. Sentinel2 L2A MAJA from
                        THEIA). You can provide a single file with extension
                        ".lst" (e.g. "filtering.lst") that lists the input
                        files to process (one input file per line in .lst)

optional arguments:
  -h, --help            show this help message and exit
  --kernel_size KERNEL_SIZE
                        Kernel size of the filter function, e.g. 3 means a
                        square of 3x3 pixels on which the filter function is
                        computed (default: 8)
  --sigma SIGMA         Standard deviation of the Gaussian distribution
                        (sigma)
  -o OUTPUT, --output OUTPUT
                        Output dir where to store results (by default current
                        dir)
  -ws WINDOW_SIZE, --window_size WINDOW_SIZE
                        Size of tiles to distribute processing, default: 1024
  -p {none,edge,maximum,mean,median,minimum,reflect,symmetric,wrap}, --pad {none,edge,maximum,mean,median,minimum,reflect,symmetric,wrap}
                        Pad to use around the image, default : edge (see https
                        ://numpy.org/doc/stable/reference/generated/numpy.pad.
                        html for more information)
  -b BANDS [BANDS ...], --bands BANDS [BANDS ...]
                        List of bands to compute
  -a, --all             Compute all bands

By default only first band is computed.
The corresponding API functions that is called by the command line interface is the following :
- eolab.georastertools.processing.algo.adaptive_gaussian(input_data: ndarray, kernel_size: int = 8, sigma: int = 1) ndarray[source]
Applies an Adaptive Gaussian Filter to the input data that smoothes the input while preserving edges.
- Parameters:
input_data (np.ndarray) – A 3D numpy array of shape (1, number_of_lines, number_of_columns) containing the Digital Elevation Model (DEM). The function only accepts arrays with one band.
kernel_size (int) – The size of the kernel used for the adaptive filtering. Default is 8.
sigma (int) – The standard deviation of the Gaussian distribution, which controls the level of smoothing. Default is 1.
- Returns:
A numpy array of the same shape as input_data, containing the filtered data.
- Return type:
np.ndarray
- Raises:
ValueError – If input_data does not have 3 dimensions or if the first dimension is not of size 1.
Here is an example of the local mean applied to the NDVI of a SENTINEL2 L2A THEIA image cropped to a region of interest. This raster was previously computed using radioindice on the original SENTINEL2 L2A THEIA image.
$ rio georastertools filter adaptive_gaussian --kernel_size 16 --sigma 1 "./SENTINEL2A_20180928-105515-685_L2A_T30TYP_D-ndvi.tif"
Original
Filtered by Adaptive gaussian
