zonalstats
zonalstats (or zs) computes zonal statistics of an input raster. The zones are defined by
a vector file (shapefile, geojson, etc.). If no vector file is provided, the statistics are
computed on the whole image.
Statistics inside a geometry can be computed for different categories also defined by a vector file. For instance, is is possible to compute the average height of buildings and vegetation of cities using:
a Digital Elevation Model (input raster file)
a shapefile with the boundaries of cities (-g argument)
a shapefile with the buildings / vegetation classification (–category_file)
$ georastertools zonalstats --help
usage: georastertools zonalstats [-h] [-o OUTPUT] [-f OUTPUT_FORMAT]
                              [-g GEOMETRIES] [-w] [--stats STATS [STATS ...]]
                              [--categorical]
                              [--valid_threshold VALID_THRESHOLD] [--area]
                              [--prefix PREFIX] [-b BANDS [BANDS ...]] [-a]
                              [--sigma SIGMA] [-c CHARTFILE] [-d]
                              [-gi GEOM_INDEX] [--category_file CATEGORY_FILE]
                              [--category_index CATEGORY_INDEX]
                              [--category_names CATEGORY_NAMES]
                              inputs [inputs ...]

Compute zonal statistics of a raster image.

Available statistics are: min, max, range, mean, std, percentile_x (x in [0,
100]), median, mad, count, valid, nodata, sum, majority, minority, unique.

By default, only the first band is computed unless specified otherwise.

Arguments:

  inputs TEXT

  Raster files to process. You can provide a single filewith extension
  ".lst" (e.g. "zonalstats.lst") that lists the input files to process
  (one input file per line in .lst)

Options:
  -o, --output TEXT           Output directory to store results (by default
                              current directory)
  -f, --format TEXT           Output format of the results when input
                              geometries are provided (by default ESRI
                              Shapefile). Possible values are ESRI Shapefile,
                              GeoJSON, CSV, GPKG, GML
  -g, --geometry TEXT         List of geometries where to compute statistics
                              (vector like a shapefile or geojson)
  -w, --within                When activated, statistics are computed for the
                              geometries that are within the raster shape. The
                              default behaviour otherwise is to compute
                              statistics for all geometries that intersect the
                              raster shape.
  --stats TEXT                List of stats to compute. Possible stats are:
                              min max range mean std percentile_x (x in [0,
                              100]) median mad count valid nodata sum majority
                              minority unique
  --categorical               If the input raster is categorical (i.e. raster
                              values represent discrete classes) compute the
                              counts of every unique pixel values.
  --valid_threshold FLOAT     Minimum percentage of valid pixels in a shape to
                              compute its statistics.
  --area                      Whether to multiply all stats by the area of a
                              cell of the input raster.
  --prefix TEXT               Add a prefix to the keys (default: None). One
                              prefix per band (e.g. 'band1 band2')
  -b, --bands INTEGER         List of bands to process
  -a, --all                   Process all bands
  --sigma TEXT                Distance to the mean value (in sigma) in order
                              to produce a raster that highlights outliers.
  -c, --chart TEXT            Generate a chart per stat and per geometry
                              (x=timestamp of the input products / y=stat
                              value) and store it in the file defined by this
                              argument
  -d, --display               Display the chart
  -gi, --geometry-index TEXT  Name of the geometry index used for the chart
                              (default='ID')
  --category_file TEXT        File (raster or geometries) containing discrete
                              classes classifying the ROI.
  --category_index TEXT       Column name identifying categories in
                              categroy_file (only if file format is
                              geometries)
  --category_names TEXT       JSON files containing a dict with classes index
                              as keys and names to display classes as values.
  -h, --help                  Show this message and exit.
When -g option is set with a valid geometries file, zonalstats generate a new vector file with the following metadata:
[prefix].name : name of the band (if available in the input raster)
[prefix].date : date of the input raster (if the raster has one of the configured raster types, either a built-in raster type or an additional custom raster type)
[prefix].[stat] : values of the statistics
[prefix].[pixel] : count of pixels having value = [pixel] when the categorical option is activated
[prefix].[category][stat] : values of the statistics for the category [category] when the category_names option is activated.
With :
[prefix] : prefix defined in the command line. If not set in the command line: b[band_number]
[stat] : name of the statistics, e.g. mean, std
If no vector file is set in the command line, the statistics are stored in a new vector file that contains a single entry whose geometry is the raster shape (without the zones of nodata).
Examples:
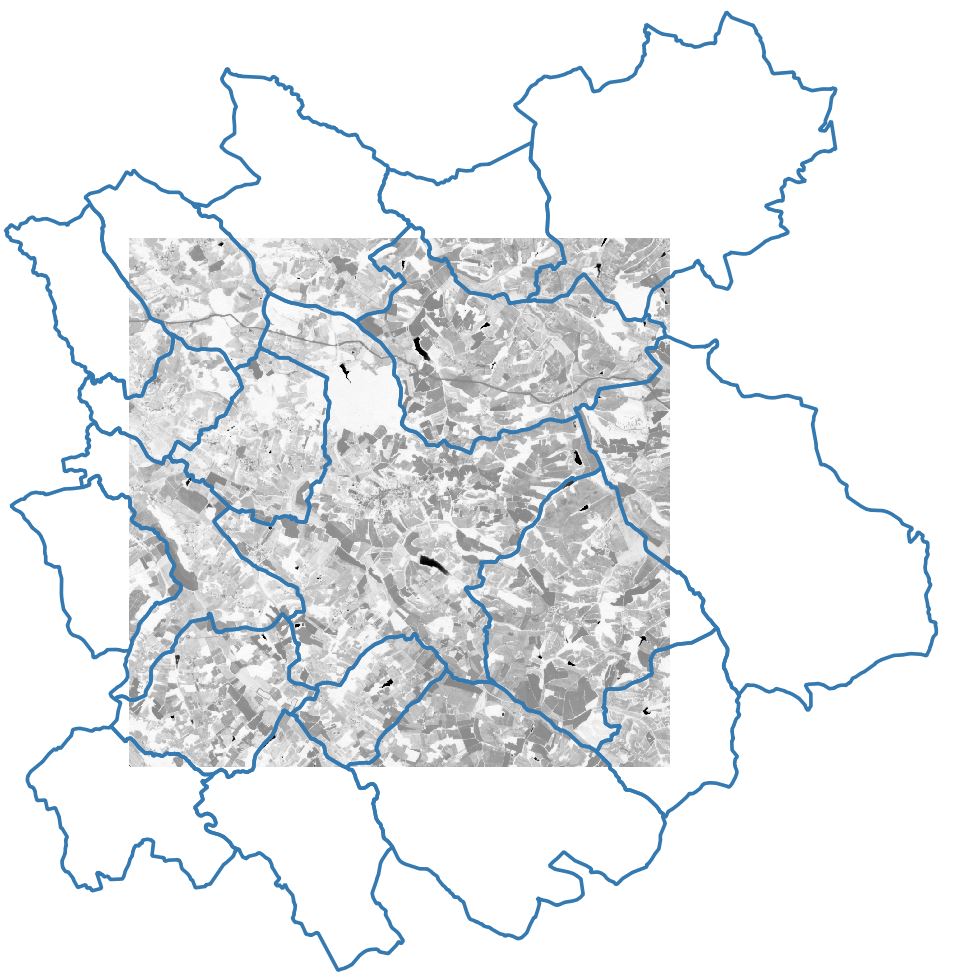
The following examples use an input raster file generated by radioindice. This is an NDVI of a SENTINEL2 L2A THEIA image that covers most of the cities we are interested in.
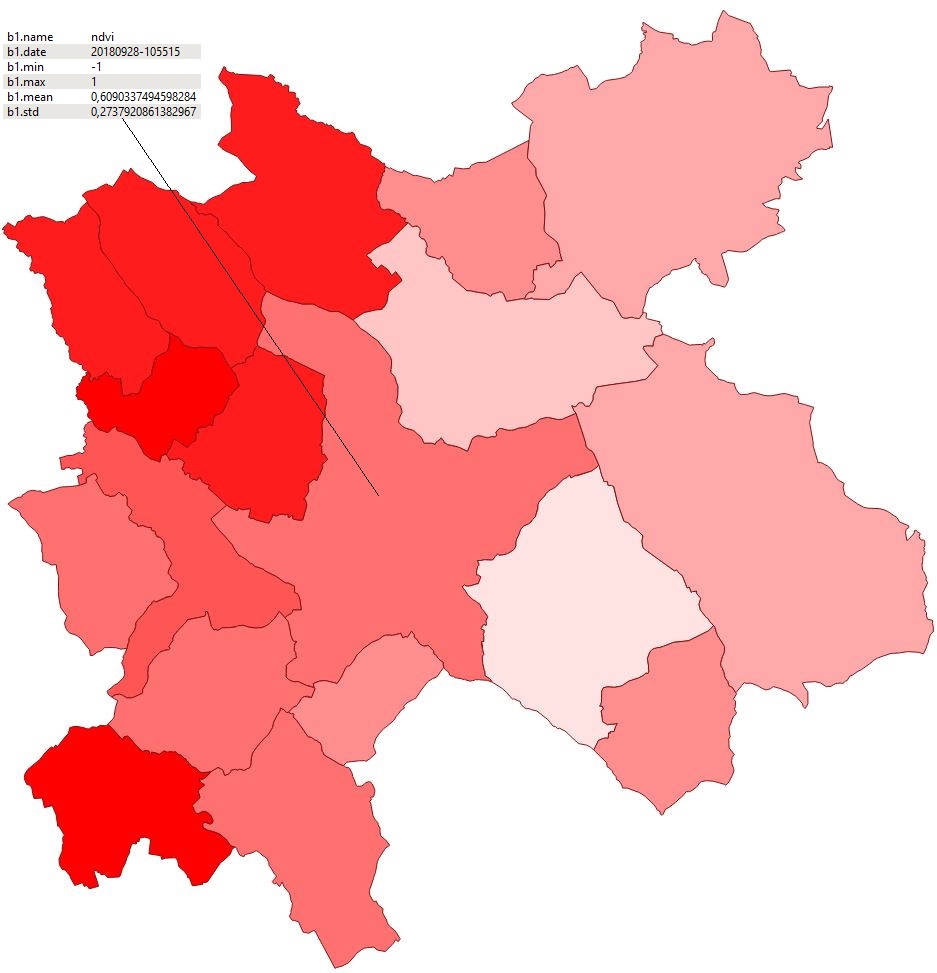
The first command generates statistics of ndvi values for several cities
$ georastertools zs -f GeoJSON -g COMMUNE_32.geojson --stats min max mean std SENTINEL2A_20180928-105515-685_L2A_T30TYP_D-ndvi.tif
This generates a new vector file that contains for each entity the stats values.
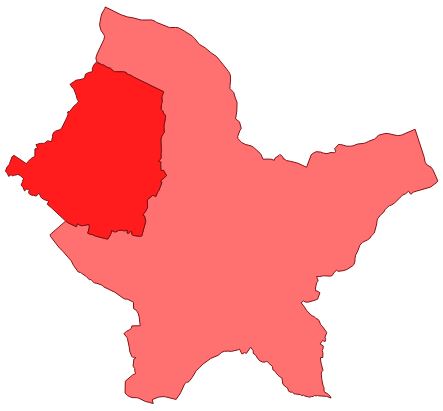
Notice that some cities are partially covered by the input raster and their statistics are thus probably not fully relevant. To disable the computation for these cities, use option –within.
$ georastertools zs -f GeoJSON -g COMMUNE_32.geojson --within --stats min max mean std SENTINEL2A_20180928-105515-685_L2A_T30TYP_D-ndvi.tif
The new vector file is now:
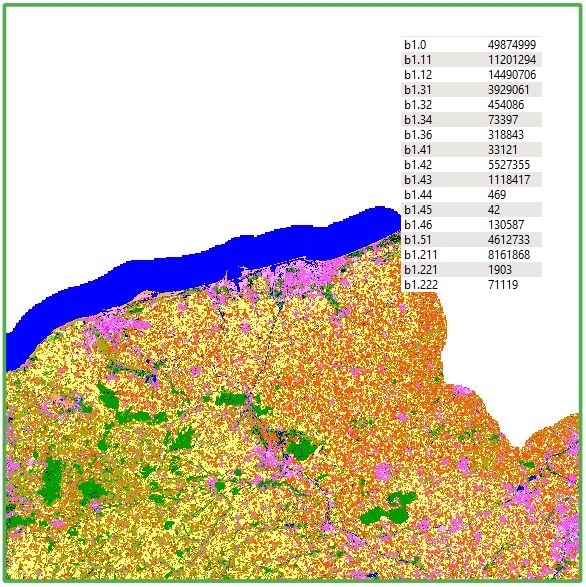
Let’s use another raster file that corresponds to a land cover map named OSO. In this map, every pixel has a value that represents its class (for instance: 1=dense urban area).
The following command line enables to count the pixels of every classes:
$ georastertools zs -f GeoJSON --categorical OCS_2017_CESBIO.tif
The generated vector file contains one geometry (a green square that corresponds to the shape of the input raster) with the number of pixels for each category: